
A more visual and flexible way to learn
At CodeGrade, our goal is to make programming education engaging and accessible. With these new features, we’re improving both the learning experience and the flow of feedback during quizzes and exercises.
Educators can now blend visual outputs, like plots or charts, directly into quizzes — all within a single, continuous view. This is ideal for courses that teach data visualization, statistics, or data science, where seeing results immediately helps deepen understanding.
Display Python plots right in the editor
You can now render matplotlib, seaborn, and other Python plots directly in CodeGrade’s editor view. This means that students can visualize their code output — graphs, histograms, scatter plots — without leaving the coding environment.
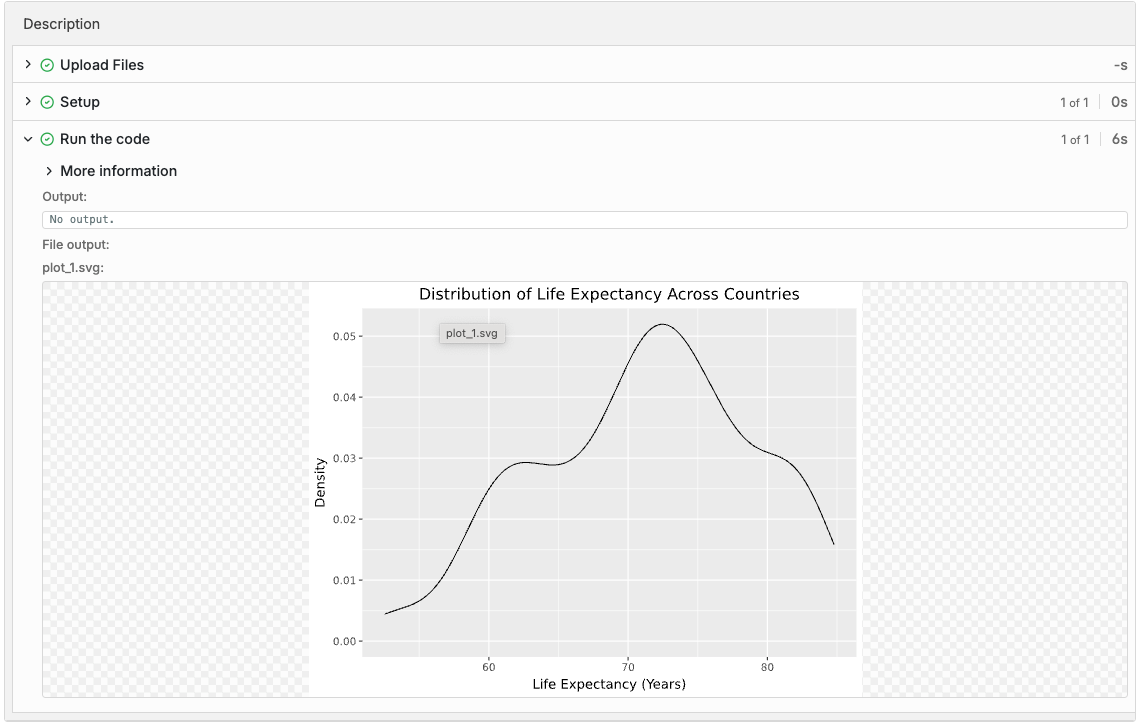
This feature not only enhances interactivity but also makes it easier to grade assignments where visual results matter. Instructors can review plots alongside the student’s code and output, all in one place.
Choose your quiz layout: single-page or page-per-question
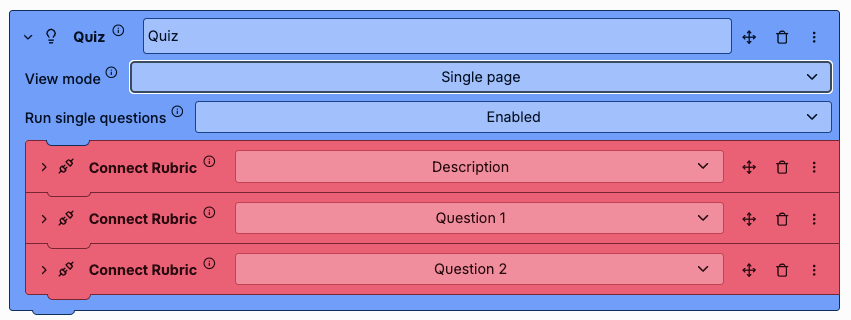
Previously, quiz questions appeared one per page. While this works well for focused assessments, many instructors prefer a quicker overview. You can now toggle between Single Page Mode and Page-per-Question Mode.
- Single Page Mode: All questions appear together, so students can move freely between them.
- Page-per-Question Mode: One question per screen for a more controlled testing experience.
This flexibility allows you to design quizzes that match your teaching style — from exploratory practice sessions to formal assessments.
Combine both for interactive quizzes
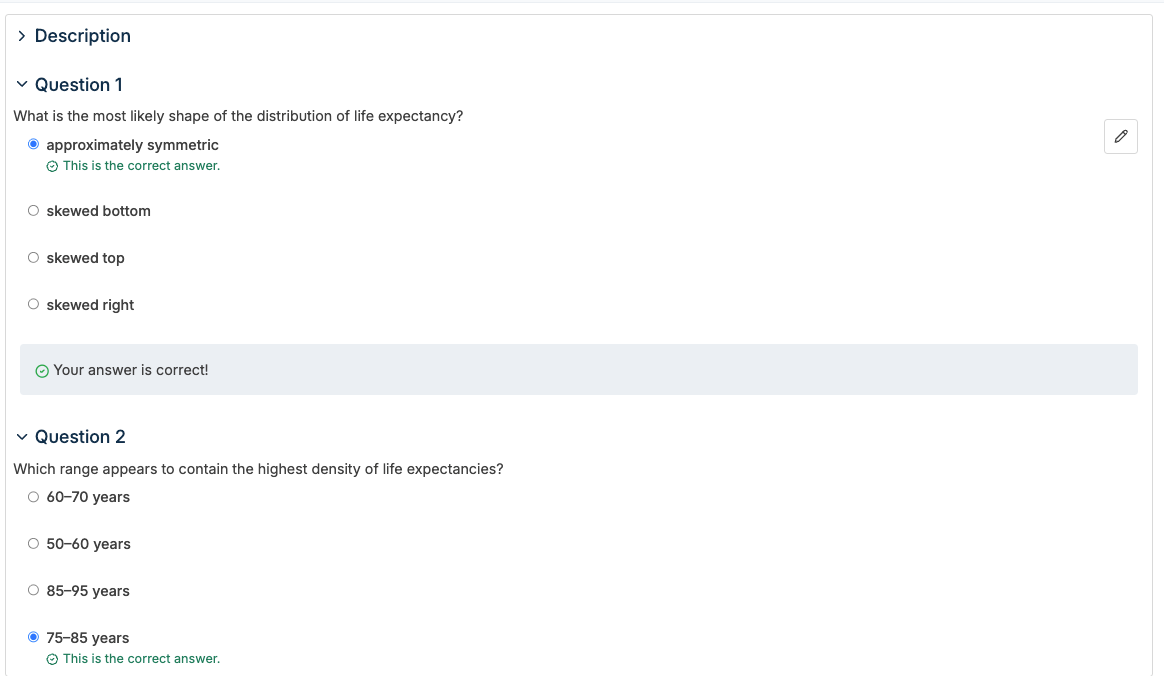
These two updates work even better together. Imagine a data science quiz where students write short Python scripts, instantly see their plot output below, and answer follow-up questions on the same page.
This combination transforms quizzes into hands-on learning experiences, helping students connect theory and practice in real time.
How to get started
1. Enable Python plot rendering
- In your Python assignments or quizzes install cg-plot-capture via pip, in the Setup tab.
pip install cg-plot-capture- In the Tests tab, run the Python code like so:
export MPLBACKEND=cg_plot_capture
python3 your_script.py- You can also add this to .cg_bash_env, for use with other types of tests
echo 'export MPLBACKEND=cg_plot_capture' >> ~/.cg_bash_env
You can find more information about the package here: https://pypi.org/project/cg-plot-capture/
2. Select your quiz layout
- Add a Quiz block to your Tests
- Choose between Single Page or Page-per-Question view mode.
- Publish your snapshot when your assignment is ready.
3. Combine for interactive learning.
- Add short Python questions that produce plots.
- Use the single-page layout so students can see their results as they progress.
These updates make it easier to teach coding concepts visually and interactively — whether you’re building a data analysis exercise or an introductory quiz. Try it out now in your next quiz or Python assignment, or book a demo with our team to explore how these new features can enhance your classroom experience.
%20(800%20x%20525%20px)%20(15).png)
%20(800%20x%20525%20px)%20(11).png)
%20(800%20x%20525%20px)%20(10).png)